Pandas 1: introduzione
Riferimenti: SoftPython - pandas 1
- visualizza al meglio in

- versione stampabile: clicca qua
- per navigare nelle slide: premere
Esc
Summer School Data Science 2023 - Modulo 1 informatica: Moodle
Docente: David Leoni david.leoni@unitn.it
Esercitatore: Luca Bosotti luca.bosotti@studenti.unitn.it
Dov'è Pandas?
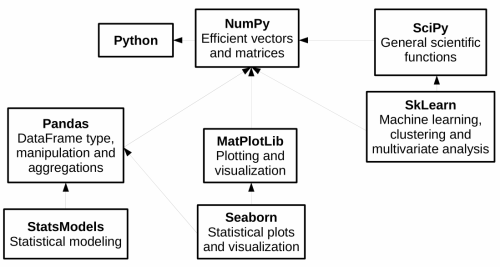
Perchè Pandas?
Per analizzare rapidamente dataset che stanno in RAM
Astropi: un dataset... spaziale!
- File: astropi.csv
- Fonte: ESA / Raspberry foundation (abbiamo sostituito ROW_ID con time_stamp)

Carichiamo il dataset
- ricordarti l'encoding
import pandas as pd
import numpy as np
df = pd.read_csv('astropi.csv', encoding='UTF-8')
df.info()
<class 'pandas.core.frame.DataFrame'>
RangeIndex: 110869 entries, 0 to 110868
Data columns (total 19 columns):
 #   Column      Non-Null Count   Dtype
---  ------      --------------   -----
 0   time_stamp  110869 non-null  object
 1   temp_cpu    110869 non-null  float64
 2   temp_h      110869 non-null  float64
 3   temp_p      110869 non-null  float64
 4   humidity    110869 non-null  float64
 5   pressure    110869 non-null  float64
 6   pitch       110869 non-null  float64
 7   roll        110869 non-null  float64
 8   yaw         110869 non-null  float64
 9   mag_x       110869 non-null  float64
 10  mag_y       110869 non-null  float64
 11  mag_z       110869 non-null  float64
 12  accel_x     110869 non-null  float64
 13  accel_y     110869 non-null  float64
 14  accel_z     110869 non-null  float64
 15  gyro_x      110869 non-null  float64
 16  gyro_y      110869 non-null  float64
 17  gyro_z      110869 non-null  float64
 18  reset       110869 non-null  int64
dtypes: float64(17), int64(1), object(1)
memory usage: 16.1+ MB
Memoria
Perchè c'è + dopo i megabyte?
- Prova ad aggiungere il parametro
memory_usage="deep"alla chiamatadf.info - Confronta con quanto occupa in Windows
Esploriamo
df.head(3)
| time_stamp | temp_cpu | temp_h | temp_p | humidity | pressure | pitch | roll | yaw | mag_x | mag_y | mag_z | accel_x | accel_y | accel_z | gyro_x | gyro_y | gyro_z | reset | |
|---|---|---|---|---|---|---|---|---|---|---|---|---|---|---|---|---|---|---|---|
| 0 | 2016-02-16 10:44:40 | 31.88 | 27.57 | 25.01 | 44.94 | 1001.68 | 1.49 | 52.25 | 185.21 | -46.422753 | -8.132907 | -12.129346 | -0.000468 | 0.019439 | 0.014569 | 0.000942 | 0.000492 | -0.000750 | 20 |
| 1 | 2016-02-16 10:44:50 | 31.79 | 27.53 | 25.01 | 45.12 | 1001.72 | 1.03 | 53.73 | 186.72 | -48.778951 | -8.304243 | -12.943096 | -0.000614 | 0.019436 | 0.014577 | 0.000218 | -0.000005 | -0.000235 | 0 |
| 2 | 2016-02-16 10:45:00 | 31.66 | 27.53 | 25.01 | 45.12 | 1001.72 | 1.24 | 53.57 | 186.21 | -49.161878 | -8.470832 | -12.642772 | -0.000569 | 0.019359 | 0.014357 | 0.000395 | 0.000600 | -0.000003 | 0 |
df.tail(3)
| time_stamp | temp_cpu | temp_h | temp_p | humidity | pressure | pitch | roll | yaw | mag_x | mag_y | mag_z | accel_x | accel_y | accel_z | gyro_x | gyro_y | gyro_z | reset | |
|---|---|---|---|---|---|---|---|---|---|---|---|---|---|---|---|---|---|---|---|
| 110866 | 2016-02-29 09:24:41 | 31.58 | 27.50 | 24.83 | 42.83 | 1005.85 | 2.09 | 50.00 | 132.04 | -16.646212 | -27.719479 | 1.629533 | -0.000647 | 0.017657 | 0.014799 | 0.000537 | 0.000257 | 0.000057 | 0 |
| 110867 | 2016-02-29 09:24:50 | 31.62 | 27.50 | 24.83 | 42.81 | 1005.88 | 2.88 | 49.69 | 133.00 | -17.270447 | -27.793136 | 1.703806 | -0.000835 | 0.017635 | 0.014877 | 0.000534 | 0.000456 | 0.000195 | 0 |
| 110868 | 2016-02-29 09:25:00 | 31.57 | 27.51 | 24.83 | 42.94 | 1005.86 | 2.17 | 49.77 | 134.18 | -17.885872 | -27.824149 | 1.293345 | -0.000787 | 0.017261 | 0.014380 | 0.000459 | 0.000076 | 0.000030 | 0 |
Qualche statistica 1/2
df.describe()
| temp_cpu | temp_h | temp_p | humidity | pressure | pitch | roll | yaw | mag_x | mag_y | mag_z | accel_x | accel_y | accel_z | gyro_x | gyro_y | gyro_z | reset | |
|---|---|---|---|---|---|---|---|---|---|---|---|---|---|---|---|---|---|---|
| count | 110869.000000 | 110869.000000 | 110869.000000 | 110869.000000 | 110869.000000 | 110869.000000 | 110869.000000 | 110869.00000 | 110869.000000 | 110869.000000 | 110869.000000 | 110869.000000 | 110869.000000 | 110869.000000 | 1.108690e+05 | 110869.000000 | 1.108690e+05 | 110869.000000 |
| mean | 32.236259 | 28.101773 | 25.543272 | 46.252005 | 1008.126788 | 2.770553 | 51.807973 | 200.90126 | -19.465265 | -1.174493 | -6.004529 | -0.000630 | 0.018504 | 0.014512 | -8.959493e-07 | 0.000007 | -9.671594e-07 | 0.000180 |
| std | 0.360289 | 0.369256 | 0.380877 | 1.907273 | 3.093485 | 21.848940 | 2.085821 | 84.47763 | 28.120202 | 15.655121 | 8.552481 | 0.000224 | 0.000604 | 0.000312 | 2.807614e-03 | 0.002456 | 2.133104e-03 | 0.060065 |
| min | 31.410000 | 27.200000 | 24.530000 | 42.270000 | 1001.560000 | 0.000000 | 30.890000 | 0.01000 | -73.046240 | -43.810030 | -41.163040 | -0.025034 | -0.005903 | -0.022900 | -3.037930e-01 | -0.378412 | -2.970800e-01 | 0.000000 |
| 25% | 31.960000 | 27.840000 | 25.260000 | 45.230000 | 1006.090000 | 1.140000 | 51.180000 | 162.43000 | -41.742792 | -12.982321 | -11.238430 | -0.000697 | 0.018009 | 0.014349 | -2.750000e-04 | -0.000278 | -1.200000e-04 | 0.000000 |
| 50% | 32.280000 | 28.110000 | 25.570000 | 46.130000 | 1007.650000 | 1.450000 | 51.950000 | 190.58000 | -21.339485 | -1.350467 | -5.764400 | -0.000631 | 0.018620 | 0.014510 | -3.000000e-06 | -0.000004 | -1.000000e-06 | 0.000000 |
| 75% | 32.480000 | 28.360000 | 25.790000 | 46.880000 | 1010.270000 | 1.740000 | 52.450000 | 256.34000 | 7.299000 | 11.912456 | -0.653705 | -0.000567 | 0.018940 | 0.014673 | 2.710000e-04 | 0.000271 | 1.190000e-04 | 0.000000 |
| max | 33.700000 | 29.280000 | 26.810000 | 60.590000 | 1021.780000 | 360.000000 | 359.400000 | 359.98000 | 33.134748 | 37.552135 | 31.003047 | 0.018708 | 0.041012 | 0.029938 | 2.151470e-01 | 0.389499 | 2.698760e-01 | 20.000000 |
DOMANDA: mancano campi? Perchè?
Qualche statistica 2/2
df.corr()
| temp_cpu | temp_h | temp_p | humidity | pressure | pitch | roll | yaw | mag_x | mag_y | mag_z | accel_x | accel_y | accel_z | gyro_x | gyro_y | gyro_z | reset | |
|---|---|---|---|---|---|---|---|---|---|---|---|---|---|---|---|---|---|---|
| temp_cpu | 1.000000 | 0.986872 | 0.991672 | -0.297081 | 0.038065 | 0.008076 | -0.171644 | -0.117972 | 0.005145 | -0.285192 | -0.120838 | -0.023582 | -0.446358 | -0.029155 | 0.002511 | 0.005947 | -0.001250 | -0.002970 |
| temp_h | 0.986872 | 1.000000 | 0.993260 | -0.281422 | 0.070882 | 0.005145 | -0.199628 | -0.117870 | 0.000428 | -0.276276 | -0.098864 | -0.032188 | -0.510126 | -0.043213 | 0.001771 | 0.005020 | -0.001423 | -0.004325 |
| temp_p | 0.991672 | 0.993260 | 1.000000 | -0.288373 | 0.035496 | 0.006750 | -0.163685 | -0.118463 | 0.004338 | -0.283427 | -0.114407 | -0.018047 | -0.428884 | -0.036505 | 0.001829 | 0.006127 | -0.001623 | -0.004205 |
| humidity | -0.297081 | -0.281422 | -0.288373 | 1.000000 | 0.434374 | 0.004050 | 0.101304 | 0.031664 | -0.035146 | 0.077897 | 0.076424 | -0.009741 | 0.226281 | 0.005281 | 0.004345 | 0.003457 | 0.001298 | -0.002066 |
| pressure | 0.038065 | 0.070882 | 0.035496 | 0.434374 | 1.000000 | 0.003018 | 0.011815 | -0.051697 | -0.040183 | -0.074578 | 0.092352 | 0.013556 | -0.115642 | -0.221208 | -0.000611 | -0.002493 | -0.000615 | -0.006259 |
| pitch | 0.008076 | 0.005145 | 0.006750 | 0.004050 | 0.003018 | 1.000000 | 0.087941 | -0.011611 | 0.013331 | 0.006133 | 0.000540 | 0.043285 | 0.009015 | -0.039146 | 0.066618 | -0.015034 | 0.049340 | -0.000176 |
| roll | -0.171644 | -0.199628 | -0.163685 | 0.101304 | 0.011815 | 0.087941 | 1.000000 | 0.095354 | -0.020947 | 0.060297 | -0.080620 | 0.116637 | 0.462630 | -0.167905 | -0.115873 | -0.002509 | -0.214202 | 0.000636 |
| yaw | -0.117972 | -0.117870 | -0.118463 | 0.031664 | -0.051697 | -0.011611 | 0.095354 | 1.000000 | 0.257971 | 0.549394 | -0.328360 | 0.006943 | 0.044157 | -0.013634 | 0.003106 | 0.003665 | 0.004020 | -0.000558 |
| mag_x | 0.005145 | 0.000428 | 0.004338 | -0.035146 | -0.040183 | 0.013331 | -0.020947 | 0.257971 | 1.000000 | 0.001239 | -0.213070 | -0.006629 | 0.027921 | 0.021524 | -0.004954 | -0.004429 | -0.005052 | -0.002879 |
| mag_y | -0.285192 | -0.276276 | -0.283427 | 0.077897 | -0.074578 | 0.006133 | 0.060297 | 0.549394 | 0.001239 | 1.000000 | -0.266351 | 0.014057 | 0.051619 | -0.053016 | 0.001239 | 0.001063 | 0.001530 | -0.001335 |
| mag_z | -0.120838 | -0.098864 | -0.114407 | 0.076424 | 0.092352 | 0.000540 | -0.080620 | -0.328360 | -0.213070 | -0.266351 | 1.000000 | 0.024718 | -0.083914 | -0.061317 | -0.008470 | -0.009557 | -0.008997 | -0.002151 |
| accel_x | -0.023582 | -0.032188 | -0.018047 | -0.009741 | 0.013556 | 0.043285 | 0.116637 | 0.006943 | -0.006629 | 0.014057 | 0.024718 | 1.000000 | 0.095286 | -0.262305 | 0.035314 | 0.103449 | 0.197740 | 0.002173 |
| accel_y | -0.446358 | -0.510126 | -0.428884 | 0.226281 | -0.115642 | 0.009015 | 0.462630 | 0.044157 | 0.027921 | 0.051619 | -0.083914 | 0.095286 | 1.000000 | 0.120215 | 0.043263 | -0.046463 | 0.009541 | 0.004648 |
| accel_z | -0.029155 | -0.043213 | -0.036505 | 0.005281 | -0.221208 | -0.039146 | -0.167905 | -0.013634 | 0.021524 | -0.053016 | -0.061317 | -0.262305 | 0.120215 | 1.000000 | 0.078315 | -0.075625 | 0.057075 | 0.000554 |
| gyro_x | 0.002511 | 0.001771 | 0.001829 | 0.004345 | -0.000611 | 0.066618 | -0.115873 | 0.003106 | -0.004954 | 0.001239 | -0.008470 | 0.035314 | 0.043263 | 0.078315 | 1.000000 | -0.248968 | 0.337553 | 0.001009 |
| gyro_y | 0.005947 | 0.005020 | 0.006127 | 0.003457 | -0.002493 | -0.015034 | -0.002509 | 0.003665 | -0.004429 | 0.001063 | -0.009557 | 0.103449 | -0.046463 | -0.075625 | -0.248968 | 1.000000 | 0.190112 | 0.000593 |
| gyro_z | -0.001250 | -0.001423 | -0.001623 | 0.001298 | -0.000615 | 0.049340 | -0.214202 | 0.004020 | -0.005052 | 0.001530 | -0.008997 | 0.197740 | 0.009541 | 0.057075 | 0.337553 | 0.190112 | 1.000000 | -0.001055 |
| reset | -0.002970 | -0.004325 | -0.004205 | -0.002066 | -0.006259 | -0.000176 | 0.000636 | -0.000558 | -0.002879 | -0.001335 | -0.002151 | 0.002173 | 0.004648 | 0.000554 | 0.001009 | 0.000593 | -0.001055 | 1.000000 |
Astropi: Le colonne
df.columns
Index(['time_stamp', 'temp_cpu', 'temp_h', 'temp_p', 'humidity', 'pressure',
       'pitch', 'roll', 'yaw', 'mag_x', 'mag_y', 'mag_z', 'accel_x', 'accel_y',
       'accel_z', 'gyro_x', 'gyro_y', 'gyro_z', 'reset'],
      dtype='object')
- Che sequenza è?
- E' iterabile?
- E' indicizzabile?
Una colonna, due notazioni 1/2
df['humidity']
0         44.94
1         45.12
2         45.12
3         45.32
4         45.18
          ...
110864    42.94
110865    42.72
110866    42.83
110867    42.81
110868    42.94
Name: humidity, Length: 110869, dtype: float64
df.humidity
0         44.94
1         45.12
2         45.12
3         45.32
4         45.18
          ...
110864    42.94
110865    42.72
110866    42.83
110867    42.81
110868    42.94
Name: humidity, Length: 110869, dtype: float64
Una colonna, due notazioni 2/2
DOMANDA: In genere, funzionerà con tutti i campi?
Una colonna: esploriamo!
Come possiamo sapere qual'è il tipo di una colonna?
Prova a iterare
Prova ad accedere ad una cella specifica
Esercizio - info meteo
- Crea dataframe
meteoda file meteo.csv, assegna il dataframe ad una variabile chiamatameteo(fonte dati: meteotrentino.it) - Visualizza qualche info
COLONNE: Data, Pressione, Pioggia, Temp

INFO:
<class 'pandas.core.frame.DataFrame'>
RangeIndex: 2878 entries, 0 to 2877
Data columns (total 4 columns):
 #   Column     Non-Null Count  Dtype
---  ------     --------------  -----
 0   Data       2878 non-null   object
 1   Pressione  2878 non-null   float64
 2   Pioggia    2878 non-null   float64
 3   Temp       2878 non-null   float64
dtypes: float64(3), object(1)
memory usage: 272.7 KB

PRIME RIGHE:
               Data  Pressione  Pioggia  Temp
0  01/11/2017 00:00      995.4      0.0   5.4
1  01/11/2017 00:15      995.5      0.0   6.0
2  01/11/2017 00:30      995.5      0.0   5.9
3  01/11/2017 00:45      995.7      0.0   5.4
4  01/11/2017 01:00      995.7      0.0   5.3
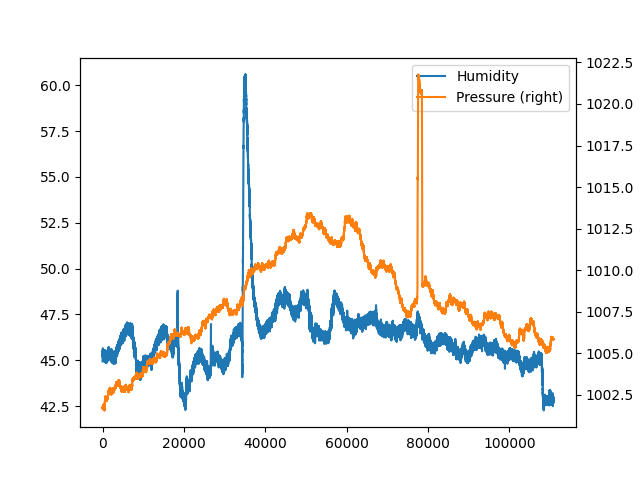
Plottiamo!
%matplotlib inline
import matplotlib as mpl
import matplotlib.pyplot as plt

df.humidity.plot(label="Humidity",
                 legend=True)

df.pressure.plot(secondary_y=True,
                 label="Pressure",
                 legend=True);
plt.show()
|
|
per asse y a destra del grafico pressione: secondary_y=True
Il caro vecchio plt.plot
df.index # Per ottenere le coordinate x
RangeIndex(start=0, stop=110869, step=1)
plt.plot(df.index, df['humidity']); # df.index si può usare come sequenza iterabile

Operazioni su righe
Selezionare
Filtrare
Ordinare
Selezionare righe con iloc
df.iloc[6]
time_stamp    2016-02-16 10:45:41
temp_cpu                    31.68
temp_h                      27.53
temp_p                      25.01
humidity                    45.31
pressure                   1001.7
pitch                        0.63
roll                        53.55
yaw                         186.1
mag_x                  -50.447346
mag_y                   -7.937309
mag_z                  -12.188574
accel_x                  -0.00051
accel_y                  0.019264
accel_z                  0.014528
gyro_x                  -0.000111
gyro_y                    0.00032
gyro_z                   0.000222
reset                           0
Name: 6, dtype: object
Che tipo ci viene tornato?
Selezionare slice con iloc
df2=df.iloc[12500:15000]
# Utile per zoommare!

plt.figure(figsize=(10,3))
plt.plot(df2.index, df2['humidity']);

iloc su dataframe filtrati
df2.head(3)
| time_stamp | temp_cpu | temp_h | temp_p | humidity | pressure | pitch | roll | yaw | mag_x | mag_y | mag_z | accel_x | accel_y | accel_z | gyro_x | gyro_y | gyro_z | reset | |
|---|---|---|---|---|---|---|---|---|---|---|---|---|---|---|---|---|---|---|---|
| 12500 | 2016-02-17 21:44:31 | 31.87 | 27.7 | 25.15 | 45.29 | 1004.56 | 0.85 | 52.78 | 357.18 | 30.517177 | 2.892431 | 0.371669 | -0.000618 | 0.019318 | 0.014503 | -0.000135 | -0.000257 | 0.000121 | 0 |
| 12501 | 2016-02-17 21:44:40 | 31.84 | 27.7 | 25.16 | 45.32 | 1004.58 | 0.97 | 52.73 | 357.32 | 30.364154 | 2.315241 | 0.043272 | -0.001196 | 0.019164 | 0.014545 | 0.000254 | 0.000497 | -0.000010 | 0 |
| 12502 | 2016-02-17 21:44:51 | 31.83 | 27.7 | 25.15 | 45.23 | 1004.55 | 1.40 | 52.84 | 357.76 | 29.760987 | 1.904932 | 0.037701 | -0.000617 | 0.019420 | 0.014672 | 0.000192 | 0.000081 | 0.000024 | 0 |
df2.iloc[0]
time_stamp    2016-02-17 21:44:31
temp_cpu                    31.87
temp_h                       27.7
temp_p                      25.15
humidity                    45.29
pressure                  1004.56
pitch                        0.85
roll                        52.78
yaw                        357.18
mag_x                   30.517177
mag_y                    2.892431
mag_z                    0.371669
accel_x                 -0.000618
accel_y                  0.019318
accel_z                  0.014503
gyro_x                  -0.000135
gyro_y                  -0.000257
gyro_z                   0.000121
reset                           0
Name: 12500, dtype: object
iloc vs loc
ATTENZIONE:
.iloc[0]seleziona la riga iniziale.loc[0]seleziona la riga ad indice con valore zero, se presente!
Prova .loc[0] con una slice come df2 Che succede?
df2.head(3)
| time_stamp | temp_cpu | temp_h | temp_p | humidity | pressure | pitch | roll | yaw | mag_x | mag_y | mag_z | accel_x | accel_y | accel_z | gyro_x | gyro_y | gyro_z | reset | |
|---|---|---|---|---|---|---|---|---|---|---|---|---|---|---|---|---|---|---|---|
| 12500 | 2016-02-17 21:44:31 | 31.87 | 27.7 | 25.15 | 45.29 | 1004.56 | 0.85 | 52.78 | 357.18 | 30.517177 | 2.892431 | 0.371669 | -0.000618 | 0.019318 | 0.014503 | -0.000135 | -0.000257 | 0.000121 | 0 |
| 12501 | 2016-02-17 21:44:40 | 31.84 | 27.7 | 25.16 | 45.32 | 1004.58 | 0.97 | 52.73 | 357.32 | 30.364154 | 2.315241 | 0.043272 | -0.001196 | 0.019164 | 0.014545 | 0.000254 | 0.000497 | -0.000010 | 0 |
| 12502 | 2016-02-17 21:44:51 | 31.83 | 27.7 | 25.15 | 45.23 | 1004.55 | 1.40 | 52.84 | 357.76 | 29.760987 | 1.904932 | 0.037701 | -0.000617 | 0.019420 | 0.014672 | 0.000192 | 0.000081 | 0.000024 | 0 |
Filtrare righe
df.head()
| time_stamp | temp_cpu | temp_h | temp_p | humidity | pressure | pitch | roll | yaw | mag_x | mag_y | mag_z | accel_x | accel_y | accel_z | gyro_x | gyro_y | gyro_z | reset | |
|---|---|---|---|---|---|---|---|---|---|---|---|---|---|---|---|---|---|---|---|
| 0 | 2016-02-16 10:44:40 | 31.88 | 27.57 | 25.01 | 44.94 | 1001.68 | 1.49 | 52.25 | 185.21 | -46.422753 | -8.132907 | -12.129346 | -0.000468 | 0.019439 | 0.014569 | 0.000942 | 0.000492 | -0.000750 | 20 |
| 1 | 2016-02-16 10:44:50 | 31.79 | 27.53 | 25.01 | 45.12 | 1001.72 | 1.03 | 53.73 | 186.72 | -48.778951 | -8.304243 | -12.943096 | -0.000614 | 0.019436 | 0.014577 | 0.000218 | -0.000005 | -0.000235 | 0 |
| 2 | 2016-02-16 10:45:00 | 31.66 | 27.53 | 25.01 | 45.12 | 1001.72 | 1.24 | 53.57 | 186.21 | -49.161878 | -8.470832 | -12.642772 | -0.000569 | 0.019359 | 0.014357 | 0.000395 | 0.000600 | -0.000003 | 0 |
| 3 | 2016-02-16 10:45:10 | 31.69 | 27.52 | 25.01 | 45.32 | 1001.69 | 1.57 | 53.63 | 186.03 | -49.341941 | -8.457380 | -12.615509 | -0.000575 | 0.019383 | 0.014409 | 0.000308 | 0.000577 | -0.000102 | 0 |
| 4 | 2016-02-16 10:45:20 | 31.66 | 27.54 | 25.01 | 45.18 | 1001.71 | 0.85 | 53.66 | 186.46 | -50.056683 | -8.122609 | -12.678341 | -0.000548 | 0.019378 | 0.014380 | 0.000321 | 0.000691 | 0.000272 | 0 |
df.humidity < 45.2
0          True
1          True
2          True
3         False
4          True
          ...
110864     True
110865     True
110866     True
110867     True
110868     True
Name: humidity, Length: 110869, dtype: bool
Combinare filtri
df.head()
| time_stamp | temp_cpu | temp_h | temp_p | humidity | pressure | pitch | roll | yaw | mag_x | mag_y | mag_z | accel_x | accel_y | accel_z | gyro_x | gyro_y | gyro_z | reset | |
|---|---|---|---|---|---|---|---|---|---|---|---|---|---|---|---|---|---|---|---|
| 0 | 2016-02-16 10:44:40 | 31.88 | 27.57 | 25.01 | 44.94 | 1001.68 | 1.49 | 52.25 | 185.21 | -46.422753 | -8.132907 | -12.129346 | -0.000468 | 0.019439 | 0.014569 | 0.000942 | 0.000492 | -0.000750 | 20 |
| 1 | 2016-02-16 10:44:50 | 31.79 | 27.53 | 25.01 | 45.12 | 1001.72 | 1.03 | 53.73 | 186.72 | -48.778951 | -8.304243 | -12.943096 | -0.000614 | 0.019436 | 0.014577 | 0.000218 | -0.000005 | -0.000235 | 0 |
| 2 | 2016-02-16 10:45:00 | 31.66 | 27.53 | 25.01 | 45.12 | 1001.72 | 1.24 | 53.57 | 186.21 | -49.161878 | -8.470832 | -12.642772 | -0.000569 | 0.019359 | 0.014357 | 0.000395 | 0.000600 | -0.000003 | 0 |
| 3 | 2016-02-16 10:45:10 | 31.69 | 27.52 | 25.01 | 45.32 | 1001.69 | 1.57 | 53.63 | 186.03 | -49.341941 | -8.457380 | -12.615509 | -0.000575 | 0.019383 | 0.014409 | 0.000308 | 0.000577 | -0.000102 | 0 |
| 4 | 2016-02-16 10:45:20 | 31.66 | 27.54 | 25.01 | 45.18 | 1001.71 | 0.85 | 53.66 | 186.46 | -50.056683 | -8.122609 | -12.678341 | -0.000548 | 0.019378 | 0.014380 | 0.000321 | 0.000691 | 0.000272 | 0 |
(df.humidity > 45.0) & (df.humidity < 45.2) # come numpy!
0         False
1          True
2          True
3         False
4          True
          ...
110864    False
110865    False
110866    False
110867    False
110868    False
Name: humidity, Length: 110869, dtype: bool
Combinare filtri: or ?
(df.humidity < 45.0) | (df.humidity > 45.2)
0          True
1         False
2         False
3          True
4         False
          ...
110864     True
110865     True
110866     True
110867     True
110868     True
Name: humidity, Length: 110869, dtype: bool
Applicare filtri 1/2
df[ (df.humidity > 45.0) & (df.humidity < 45.2) ]
| time_stamp | temp_cpu | temp_h | temp_p | humidity | pressure | pitch | roll | yaw | mag_x | mag_y | mag_z | accel_x | accel_y | accel_z | gyro_x | gyro_y | gyro_z | reset | |
|---|---|---|---|---|---|---|---|---|---|---|---|---|---|---|---|---|---|---|---|
| 1 | 2016-02-16 10:44:50 | 31.79 | 27.53 | 25.01 | 45.12 | 1001.72 | 1.03 | 53.73 | 186.72 | -48.778951 | -8.304243 | -12.943096 | -0.000614 | 0.019436 | 0.014577 | 0.000218 | -0.000005 | -0.000235 | 0 |
| 2 | 2016-02-16 10:45:00 | 31.66 | 27.53 | 25.01 | 45.12 | 1001.72 | 1.24 | 53.57 | 186.21 | -49.161878 | -8.470832 | -12.642772 | -0.000569 | 0.019359 | 0.014357 | 0.000395 | 0.000600 | -0.000003 | 0 |
| 4 | 2016-02-16 10:45:20 | 31.66 | 27.54 | 25.01 | 45.18 | 1001.71 | 0.85 | 53.66 | 186.46 | -50.056683 | -8.122609 | -12.678341 | -0.000548 | 0.019378 | 0.014380 | 0.000321 | 0.000691 | 0.000272 | 0 |
| 5 | 2016-02-16 10:45:30 | 31.69 | 27.55 | 25.01 | 45.12 | 1001.67 | 0.85 | 53.53 | 185.52 | -50.246476 | -8.343209 | -11.938124 | -0.000536 | 0.019453 | 0.014380 | 0.000273 | 0.000494 | -0.000059 | 0 |
| 10 | 2016-02-16 10:46:20 | 31.68 | 27.53 | 25.00 | 45.16 | 1001.72 | 1.32 | 53.52 | 186.24 | -51.616473 | -6.818130 | -11.860839 | -0.000530 | 0.019477 | 0.014500 | 0.000268 | 0.001194 | 0.000106 | 0 |
| ... | ... | ... | ... | ... | ... | ... | ... | ... | ... | ... | ... | ... | ... | ... | ... | ... | ... | ... | ... |
| 108001 | 2016-02-29 01:23:30 | 32.32 | 28.20 | 25.57 | 45.05 | 1005.74 | 1.32 | 50.04 | 338.15 | 15.549799 | -1.424077 | -9.087291 | -0.000754 | 0.017375 | 0.014826 | 0.000908 | 0.000447 | 0.000149 | 0 |
| 108003 | 2016-02-29 01:23:50 | 32.28 | 28.18 | 25.57 | 45.10 | 1005.76 | 1.65 | 50.03 | 338.91 | 15.134025 | -1.776843 | -8.806690 | -0.000819 | 0.017378 | 0.014974 | 0.000048 | -0.000084 | -0.000039 | 0 |
| 108004 | 2016-02-29 01:24:00 | 32.30 | 28.18 | 25.57 | 45.11 | 1005.74 | 1.70 | 50.21 | 338.19 | 14.799790 | -1.695364 | -8.895130 | -0.000739 | 0.017478 | 0.014792 | -0.000311 | -0.000417 | -0.000008 | 0 |
| 108006 | 2016-02-29 01:24:20 | 32.29 | 28.19 | 25.57 | 45.02 | 1005.73 | 0.81 | 49.81 | 339.24 | 14.333920 | -2.173228 | -8.694976 | -0.000606 | 0.017275 | 0.014725 | -0.000589 | -0.000443 | -0.000032 | 0 |
| 108012 | 2016-02-29 01:25:21 | 32.27 | 28.19 | 25.57 | 45.01 | 1005.72 | 0.44 | 50.34 | 342.01 | 14.364146 | -2.974811 | -8.287531 | -0.000754 | 0.017800 | 0.014704 | -0.000033 | -0.000491 | 0.000309 | 0 |
7275 rows × 19 columns
Applicare filtri 2/2 - Come trovare riga la cui pressione è massima?
df[ (df.pressure == df.pressure.values.max()) ]
| time_stamp | temp_cpu | temp_h | temp_p | humidity | pressure | pitch | roll | yaw | mag_x | mag_y | mag_z | accel_x | accel_y | accel_z | gyro_x | gyro_y | gyro_z | reset | |
|---|---|---|---|---|---|---|---|---|---|---|---|---|---|---|---|---|---|---|---|
| 77602 | 2016-02-25 12:13:20 | 32.44 | 28.31 | 25.74 | 47.57 | 1021.78 | 1.1 | 51.82 | 267.39 | -0.797428 | 10.891803 | -15.728202 | -0.000612 | 0.01817 | 0.014295 | -0.000139 | -0.000179 | -0.000298 | 0 |
Ordinare
Nota: di default produce un NUOVO dataset
df.sort_values('pressure',ascending=False)
| time_stamp | temp_cpu | temp_h | temp_p | humidity | pressure | pitch | roll | yaw | mag_x | mag_y | mag_z | accel_x | accel_y | accel_z | gyro_x | gyro_y | gyro_z | reset | |
|---|---|---|---|---|---|---|---|---|---|---|---|---|---|---|---|---|---|---|---|
| 77602 | 2016-02-25 12:13:20 | 32.44 | 28.31 | 25.74 | 47.57 | 1021.78 | 1.10 | 51.82 | 267.39 | -0.797428 | 10.891803 | -15.728202 | -0.000612 | 0.018170 | 0.014295 | -0.000139 | -0.000179 | -0.000298 | 0 |
| 77601 | 2016-02-25 12:13:10 | 32.45 | 28.30 | 25.74 | 47.26 | 1021.75 | 1.53 | 51.76 | 266.12 | -1.266335 | 10.927442 | -15.690558 | -0.000661 | 0.018357 | 0.014533 | 0.000152 | 0.000459 | -0.000298 | 0 |
| 77603 | 2016-02-25 12:13:30 | 32.44 | 28.30 | 25.74 | 47.29 | 1021.75 | 1.86 | 51.83 | 268.83 | -0.320795 | 10.651441 | -15.565123 | -0.000648 | 0.018290 | 0.014372 | 0.000049 | 0.000473 | -0.000029 | 0 |
| 77604 | 2016-02-25 12:13:40 | 32.43 | 28.30 | 25.74 | 47.39 | 1021.75 | 1.78 | 51.54 | 269.41 | -0.130574 | 10.628383 | -15.488983 | -0.000672 | 0.018154 | 0.014602 | 0.000360 | 0.000089 | -0.000002 | 0 |
| 77608 | 2016-02-25 12:14:20 | 32.42 | 28.29 | 25.74 | 47.36 | 1021.73 | 0.86 | 51.89 | 272.77 | 0.952025 | 10.435951 | -16.027235 | -0.000607 | 0.018186 | 0.014232 | -0.000260 | -0.000059 | -0.000187 | 0 |
| ... | ... | ... | ... | ... | ... | ... | ... | ... | ... | ... | ... | ... | ... | ... | ... | ... | ... | ... | ... |
| 441 | 2016-02-16 11:58:41 | 31.71 | 27.49 | 24.99 | 45.05 | 1001.57 | 1.25 | 53.62 | 228.15 | -4.808056 | 1.551141 | -5.496866 | -0.000579 | 0.019500 | 0.014510 | -0.000039 | 0.000111 | 0.000098 | 0 |
| 442 | 2016-02-16 11:58:50 | 31.68 | 27.48 | 24.98 | 45.20 | 1001.57 | 2.01 | 53.24 | 226.81 | -4.815926 | 1.513994 | -5.251955 | -0.000609 | 0.019570 | 0.014721 | 0.000449 | 0.000260 | 0.000249 | 0 |
| 432 | 2016-02-16 11:57:11 | 31.67 | 27.50 | 24.99 | 45.08 | 1001.56 | 1.34 | 53.47 | 226.80 | -5.030561 | 1.955167 | -5.163678 | -0.000564 | 0.019500 | 0.014483 | 0.000365 | 0.000869 | -0.000011 | 0 |
| 440 | 2016-02-16 11:58:30 | 31.68 | 27.50 | 24.99 | 45.15 | 1001.56 | 1.47 | 53.54 | 227.68 | -4.908951 | 1.617281 | -5.434710 | -0.000566 | 0.019576 | 0.014451 | -0.000438 | 0.000080 | -0.000182 | 0 |
| 444 | 2016-02-16 11:59:11 | 31.70 | 27.49 | 24.98 | 45.00 | 1001.56 | 1.81 | 53.27 | 229.48 | -4.786967 | 1.502788 | -5.921817 | -0.000595 | 0.019500 | 0.014579 | 0.000192 | 0.000303 | 0.000104 | 0 |
110869 rows × 19 columns
Esercizio - statistiche meteo
✪ Analizza i dati del Dataframe meteo per trovare:
i valori di pressione media, minima e massima
la temperatura media
le date delle giornate di pioggia
Valori object e stringhe
Gli operatori e funzioni normali di Python operano su stringhe singole
Con Pandas dobbiamo cambiare approccio
Collezione di funzioni che operano su serie di stringhe:
df['time_stamp'].str
<pandas.core.strings.accessor.StringMethods at 0x7f0165d45e10>
in non funziona
Esempio: Come filtriare gli ultimi giorni di febbraio?
'2016-02-2' in df['time_stamp'] # SBAGLIATO!
False
df[ '2016-02-2' in df['time_stamp'] ] # BOOM!
---------------------------------------------------------------------------
KeyError                                  Traceback (most recent call last)
~/.local/lib/python3.7/site-packages/pandas/core/indexes/base.py in get_loc(self, key, method, tolerance)
   3360             try:
-> 3361                 return self._engine.get_loc(casted_key)
   3362             except KeyError as err:

~/.local/lib/python3.7/site-packages/pandas/_libs/index.pyx in pandas._libs.index.IndexEngine.get_loc()

~/.local/lib/python3.7/site-packages/pandas/_libs/index.pyx in pandas._libs.index.IndexEngine.get_loc()

pandas/_libs/hashtable_class_helper.pxi in pandas._libs.hashtable.PyObjectHashTable.get_item()

pandas/_libs/hashtable_class_helper.pxi in pandas._libs.hashtable.PyObjectHashTable.get_item()

KeyError: False
Come filtriare gli ultimi giorni di febbraio?
df['time_stamp'].str.contains('2016-02-2') # OK
0         False
1         False
2         False
3         False
4         False
          ...
110864     True
110865     True
110866     True
110867     True
110868     True
Name: time_stamp, Length: 110869, dtype: bool
Applichiamo il filtro con contains
Filtra ultimi giorni di febbraio:
df[ df['time_stamp'].str.contains('2016-02-2') ].head()
| time_stamp | temp_cpu | temp_h | temp_p | humidity | pressure | pitch | roll | yaw | mag_x | mag_y | mag_z | accel_x | accel_y | accel_z | gyro_x | gyro_y | gyro_z | reset | |
|---|---|---|---|---|---|---|---|---|---|---|---|---|---|---|---|---|---|---|---|
| 30442 | 2016-02-20 00:00:00 | 32.30 | 28.12 | 25.59 | 45.05 | 1008.01 | 1.47 | 51.82 | 51.18 | 9.215883 | -12.947023 | 4.066202 | -0.000612 | 0.018792 | 0.014558 | -0.000042 | 0.000275 | 0.000157 | 0 |
| 30443 | 2016-02-20 00:00:10 | 32.25 | 28.13 | 25.59 | 44.82 | 1008.02 | 0.81 | 51.53 | 52.21 | 8.710130 | -13.143595 | 3.499386 | -0.000718 | 0.019290 | 0.014667 | 0.000260 | 0.001011 | 0.000149 | 0 |
| 30444 | 2016-02-20 00:00:41 | 33.07 | 28.13 | 25.59 | 45.08 | 1008.09 | 0.68 | 51.69 | 57.36 | 7.383435 | -13.827667 | 4.438656 | -0.000700 | 0.018714 | 0.014598 | 0.000299 | 0.000343 | -0.000025 | 0 |
| 30445 | 2016-02-20 00:00:50 | 32.63 | 28.10 | 25.60 | 44.87 | 1008.07 | 1.42 | 52.13 | 59.95 | 7.292313 | -13.999682 | 4.517029 | -0.000657 | 0.018857 | 0.014565 | 0.000160 | 0.000349 | -0.000190 | 0 |
| 30446 | 2016-02-20 00:01:01 | 32.55 | 28.11 | 25.60 | 44.94 | 1008.07 | 1.41 | 51.86 | 61.83 | 6.699141 | -14.065591 | 4.448778 | -0.000678 | 0.018871 | 0.014564 | -0.000608 | -0.000381 | -0.000243 | 0 |
Slice di stringhe
Supponiamo di voler estrarre il giorno:
df['time_stamp'].head()
0    2016-02-16 10:44:40
1    2016-02-16 10:44:50
2    2016-02-16 10:45:00
3    2016-02-16 10:45:10
4    2016-02-16 10:45:20
Name: time_stamp, dtype: object
Possiamo usare .str come se fosse una stringa e applicare la solita notazione con quadre per le slice:
df['time_stamp'].str[8:10]
0         16
1         16
2         16
3         16
4         16
          ..
110864    29
110865    29
110866    29
110867    29
110868    29
Name: time_stamp, Length: 110869, dtype: object
Selezionare colonne
df[ ['temp_h', 'temp_p', 'time_stamp'] ]
| temp_h | temp_p | time_stamp | |
|---|---|---|---|
| 0 | 27.57 | 25.01 | 2016-02-16 10:44:40 |
| 1 | 27.53 | 25.01 | 2016-02-16 10:44:50 |
| 2 | 27.53 | 25.01 | 2016-02-16 10:45:00 |
| 3 | 27.52 | 25.01 | 2016-02-16 10:45:10 |
| 4 | 27.54 | 25.01 | 2016-02-16 10:45:20 |
| ... | ... | ... | ... |
| 110864 | 27.52 | 24.83 | 2016-02-29 09:24:21 |
| 110865 | 27.50 | 24.83 | 2016-02-29 09:24:30 |
| 110866 | 27.50 | 24.83 | 2016-02-29 09:24:41 |
| 110867 | 27.50 | 24.83 | 2016-02-29 09:24:50 |
| 110868 | 27.51 | 24.83 | 2016-02-29 09:25:00 |
110869 rows × 3 columns
df['mag_tot'] = df['mag_x']**2 + df['mag_y']**2 + df['mag_z']**2
Selezioniamo per vedere il risultato:
df.head()[['time_stamp', 'mag_x', 'mag_y', 'mag_z', 'mag_tot']]
| time_stamp | mag_x | mag_y | mag_z | mag_tot | |
|---|---|---|---|---|---|
| 0 | 2016-02-16 10:44:40 | -46.422753 | -8.132907 | -12.129346 | 2368.337207 |
| 1 | 2016-02-16 10:44:50 | -48.778951 | -8.304243 | -12.943096 | 2615.870247 |
| 2 | 2016-02-16 10:45:00 | -49.161878 | -8.470832 | -12.642772 | 2648.484927 |
| 3 | 2016-02-16 10:45:10 | -49.341941 | -8.457380 | -12.615509 | 2665.305485 |
| 4 | 2016-02-16 10:45:20 | -50.056683 | -8.122609 | -12.678341 | 2732.388620 |
Quando il campo magnetico è più forte?
plt.figure(figsize=(7,3))
df.mag_tot.plot();

df['time_stamp'][df.mag_tot == df.mag_tot.values.max()]
96156    2016-02-27 16:12:31
Name: time_stamp, dtype: object
Dov'era più forte? Prova a inserire il valore in questo sito: isstracker.com/historical
Esercizio - temperatura meteo in Fahrenheit
Nel dataframe meteo, crea una colonna TempFahrenheit con la temperatura misurata in gradi Fahrenheit
Formula per calcolare la conversione dai gradi Celsius (C):
$Fahrenheit = \frac{9}{5}C + 32$
Esercizio - Pressione vs Temperatura
Secondo la Legge di Gay-Lussac, in un ambiente chiuso la pressione dovrebbe essere direttamente proporzionale alla temperatura:
$\frac{P}{T} = k$
E' vero per il dataset del meteo? Prova a scoprirlo calcolando direttamente la formula e comparando con i risultati del metodo corr()
Scrivere in colonne filtrate con .loc
df.loc[ df.temp_cpu > 31.68,'cpu_troppo_calda'] = True
df.head()[['time_stamp', 'temp_cpu', 'cpu_troppo_calda']]
| time_stamp | temp_cpu | cpu_troppo_calda | |
|---|---|---|---|
| 0 | 2016-02-16 10:44:40 | 31.88 | True |
| 1 | 2016-02-16 10:44:50 | 31.79 | True |
| 2 | 2016-02-16 10:45:00 | 31.66 | NaN |
| 3 | 2016-02-16 10:45:10 | 31.69 | True |
| 4 | 2016-02-16 10:45:20 | 31.66 | NaN |
DOMANDA: cosa ha scritto nelle righe non selezionate?
Scrivere in colonne filtrate con .where
pressione_media = df.pressure.values.mean()
df['controllo_pressione']=np.where(df.pressure <= pressione_media,'sotto','sopra')
Selezioniamo per vedere righe con variazioni:
df.iloc[29739:29745][['time_stamp', 'pressure', 'controllo_pressione']]
| time_stamp | pressure | controllo_pressione | |
|---|---|---|---|
| 29739 | 2016-02-19 22:01:30 | 1008.10 | sotto |
| 29740 | 2016-02-19 22:01:40 | 1008.11 | sotto |
| 29741 | 2016-02-19 22:01:50 | 1008.15 | sopra |
| 29742 | 2016-02-19 22:02:01 | 1008.13 | sopra |
| 29743 | 2016-02-19 22:02:10 | 1008.11 | sotto |
| 29744 | 2016-02-19 22:02:21 | 1008.12 | sotto |
Trasformare una colonna - un problema
Come convertire tutti i valori della colonna umidità da float a interi?
df['humidity']
0         44.94
1         45.12
2         45.12
3         45.32
4         45.18
          ...
110864    42.94
110865    42.72
110866    42.83
110867    42.81
110868    42.94
Name: humidity, Length: 110869, dtype: float64
Intanto, come convertire UN solo valore?
int(44.12)
44
Come trasformare TUTTA una colonna?
Usiamo il metodo .transform:
df['humidity'].transform(int)
0         44
1         45
2         45
3         45
4         45
          ..
110864    42
110865    42
110866    42
110867    42
110868    42
Name: humidity, Length: 110869, dtype: int64
NOTA: a transform passiamo l'oggetto funzione int
DOMANDA: chi chiama int?
def mia_f(x):
    return int(x)

df['humidity'].transform(mia_f)
0         44
1         45
2         45
3         45
4         45
          ..
110864    42
110865    42
110866    42
110867    42
110868    42
Name: humidity, Length: 110869, dtype: int64
df['humidity'].transform( lambda x: int(x) )
0         44
1         45
2         45
3         45
4         45
          ..
110864    42
110865    42
110866    42
110867    42
110868    42
Name: humidity, Length: 110869, dtype: int64
Trasformare - è cambiato qualcosa?
df['humidity']
0         44.94
1         45.12
2         45.12
3         45.32
4         45.18
          ...
110864    42.94
110865    42.72
110866    42.83
110867    42.81
110868    42.94
Name: humidity, Length: 110869, dtype: float64
Trasformare veramente - riassegnamo!
df['humidity_int'] = df['humidity'].transform( lambda x: int(x) )
df[ ['time_stamp', 'humidity_int', 'humidity' ] ]
| time_stamp | humidity_int | humidity | |
|---|---|---|---|
| 0 | 2016-02-16 10:44:40 | 44 | 44.94 |
| 1 | 2016-02-16 10:44:50 | 45 | 45.12 |
| 2 | 2016-02-16 10:45:00 | 45 | 45.12 |
| 3 | 2016-02-16 10:45:10 | 45 | 45.32 |
| 4 | 2016-02-16 10:45:20 | 45 | 45.18 |
| ... | ... | ... | ... |
| 110864 | 2016-02-29 09:24:21 | 42 | 42.94 |
| 110865 | 2016-02-29 09:24:30 | 42 | 42.72 |
| 110866 | 2016-02-29 09:24:41 | 42 | 42.83 |
| 110867 | 2016-02-29 09:24:50 | 42 | 42.81 |
| 110868 | 2016-02-29 09:25:00 | 42 | 42.94 |
110869 rows × 3 columns
Altri esercizi
Vedere SoftPython