Mexican Drug Wars
Download worked project
Drug cartels carried out a shocking wave of lethal attacks against hundreds of local elected officials and party candidates in Mexico during years 2007-2012, attempting to establish criminal governance regimes and conquer local governments, populations, and territories. This quickly forced Mexican authorities to deploy armored vehicles with heavy weapons to perform military operations within their own borders. You will analyze cartels attacks frequency and where they occurred.
Data sources:
Trejo, Guillermo; Ley, Sandra, 2019, “Replication Data for: High-Profile Criminal Violence. Why Drug Cartels Murder Government Officials and Party Candidates in Mexico”, https://doi.org/10.7910/DVN/VIXNNE, Harvard Dataverse, V1, UNF:6:BcqInKD9NBX3NkI48CdqpQ== [fileUNF] License: CC0 - “Public Domain Dedication”
Coscia, Michele and Viridiana Rios (2012). Knowing Where and How Criminal Organizations Operate Using Web Content. CIKM, 12 (October – November). https://www.michelecoscia.com/?page_id=1032
What to do
Unzip exercises zip in a folder, you should obtain something like this:
bus-speed-prj
    mexican-drug-wars.ipynb
    mexican-drug-wars-sol.ipynb

    jupman.py
WARNING: to correctly visualize the notebook, it MUST be in an unzipped folder !
open Jupyter Notebook from that folder. Two things should open, first a console and then a browser. The browser should show a file list: navigate the list and open the notebook
mexican-drug-wars.ipynbGo on reading the notebook, and write in the appropriate cells when asked
Shortcut keys:
to execute Python code inside a Jupyter cell, press
Control + Enterto execute Python code inside a Jupyter cell AND select next cell, press
Shift + Enterto execute Python code inside a Jupyter cell AND a create a new cell aftwerwards, press
Alt + EnterIf the notebooks look stuck, try to select
Kernel -> Restart
Election attacks dataset
In the file Dataset_HighProfileCriminalViolence.tab are listed the number of attacks occurred to elected officials in Mexico from years 2007 to 2012. Focus only on columns cve_inegi, state, year, aggr_sum, elect_local:
[1]:
| cve_inegi | state | year | aggr_sum | elect_local | |
|---|---|---|---|---|---|
| 2278 | 12031 | Guerrero | 2012 | 2 | 1.0 |
| 2279 | 12032 | Guerrero | 2007 | 0 | 0.0 |
| 2280 | 12032 | Guerrero | 2008 | 0 | 1.0 |
| 2281 | 12032 | Guerrero | 2009 | 1 | 0.0 |
Municipalities where the attack occurred are identified by a 5 digits
cve_inegicode: first two digits indicate the state, 3 last ones the town. NOTE: first file entries only have 4 digits as the leading zero is implied, take care of this caseaggr_sum: number of attacks occurred in a particular municipality / year.elect_local:1.0if a local election occurred in the year of the attack (ignore otherelect_*)
1. load_mexico
Extract Mexican state codes, names, the counts of attacks, and the years when local elections occurred, and RETURN a dictionary of dictionaries mapping two digit state codes as strings to the extracted info.
use
csv.DictReaderwithdelimiter='\t'andutf8encoding (municipalities will look weird but we don’t use them)use exactly 6 cells for
attackslists: assume all were carried out between2007and2012includedDO NOT assume the years in rows repeat with a pattern, for example municipality
21132has two successive 2012 years!
Example EXERPT (note keys order doesn’t matter, complete expected output can be found in expected_mexico_db.py)
>>> load('Dataset_HighProfileCriminalViolence.tab')

{
  '08': {
              'attacks': [0, 5, 7, 12, 7, 2],
              'local_election_years': [2007, 2010],
              'state_code': '08',
              'state_name': 'Chihuahua'
             }
  '12': {
              'attacks': [4, 11, 11, 9, 3, 10],
              'local_election_years': [2008, 2011, 2012],
              'state_code': '12',
              'state_name': 'Guerrero'
             }
  .
  .
  .
}
[2]:
import csv

def load(filename):
    raise Exception('TODO IMPLEMENT ME !')

mexico_db = load('Dataset_HighProfileCriminalViolence.tab')
mexico_db
[4]:
# TESTING
from pprint import pformat; from expected_mexico_db import expected_mexico_db
for sid in expected_mexico_db.keys():
    if sid not in mexico_db: print('\nERROR: MISSING state', sid); break
    for k in expected_mexico_db[sid]:
        if k not in mexico_db[sid]:
            print('\nERROR at state', sid,'\n\n   MISSING key:', k); break
        if expected_mexico_db[sid][k] != mexico_db[sid][k]:
            print('\nERROR at state', sid, 'key:',k)
            print('  ACTUAL:\n', pformat(mexico_db[sid][k]))
            print('  EXPECTED:\n', pformat(expected_mexico_db[sid][k]))
            break
if len(mexico_db) > len(expected_mexico_db):
    print('ERROR! There are more states than expected!')
    print('  ACTUAL:\n', len(mexico_db))
    print('  EXPECTED:\n', len(expected_mexico_db))
2. show_attacks
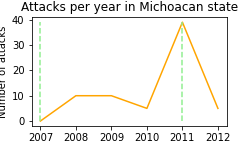
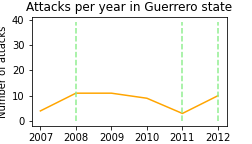
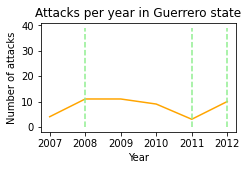
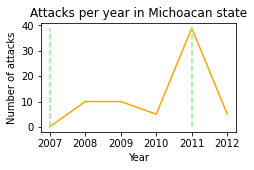
Given a state_code and , display a chart of the attack counts over the years.
normalize the height so to have all charts as high as the maximum possible attack count in the db
show vertical dashed lines in proximity of election years (use
linestyle='dashed'), using the same coloryou are allowed to use constants for years
make sure vertical lines on borders are clearly visible and separated from borders by setting proper limits
remember to also print the maximum possible attack count in the db
Examples:
>>> show_attacks('12', mexico_db)
max attacks happened in any state: 39
>>> show_attacks('16', mexico_db)
max attacks happened in any state: 39
[5]:
%matplotlib inline
import matplotlib.pyplot as plt

def show_attacks(state_code, mexdb):
    raise Exception('TODO IMPLEMENT ME !')

show_attacks('12', mexico_db)  # Guerrero
[6]:
show_attacks('16', mexico_db) # Michoacan
max attacks happened in any state: 39
3. Cartels
The file CosciaRios2012_DataBase.csv lists attacks performed by criminal organizations (cartels) in various years. For each row, the columns from 3-12 have a 1 if the corresponding cartel named in the header was involved in the attack, and 0 otherwise. Example:
[7]:
| Code | State | Year | Beltran_Leyva | Beltran_Leyva_Family | Familia | Golfo | Juarez | Sinaloa | Sinaloa_Family | Tijuana | Zetas | Otros | |
|---|---|---|---|---|---|---|---|---|---|---|---|---|---|
| 17 | 1001 | 1 | 2007 | 0 | 0 | 1 | 0 | 0 | 0 | 0 | 0 | 1 | 0 |
| 18 | 1001 | 1 | 2008 | 0 | 0 | 1 | 0 | 1 | 0 | 0 | 0 | 0 | 0 |
| 19 | 1001 | 1 | 2009 | 0 | 0 | 1 | 1 | 0 | 1 | 0 | 0 | 1 | 0 |
Write a function which given a filename and a year, processes the dataset and RETURN a dictionary mapping cartel names to a list of sorted states (no duplicates) where the cartel performed attacks in the given year.
use a
csv.readerwithutf8encodingpick state code from
Statecolumn and state names from previousmexico_db(you only need names) - if missing put state code (i.e.09)NOTE:
Sinaloais a special case, since it is both a state and a cartel.
Example:
>>> cartels('CosciaRios2012_DataBase.csv', mexico_db, 2003)

{
 'Beltran_Leyva': ['Colima', 'Morelos', 'Sinaloa'],
 'Beltran_Leyva_Family': [],
 'Familia': [],
 'Golfo': ['Campeche',   'Chihuahua',       'Coahuila',   'Durango',  'Mexico',
           'Nuevo Leon', 'San Luis Potosi', 'Tamaulipas', 'Veracruz', 'Yucatan'],
 'Juarez': ['Baja California', 'Chihuahua', 'Coahuila', 'Colima',
            'Durango', 'Guerrero', 'Jalisco', 'Sinaloa', 'Tamaulipas'],
 'Otros': ['Veracruz'],
 'Sinaloa': ['Chiapas', 'Colima',     'Jalisco', 'Mexico',
             'Nayarit', 'Nuevo Leon', 'Sinaloa', 'Sonora', 'Tamaulipas'],
 'Sinaloa_Family': ['Guerrero'],
 'Tijuana': ['Aguascalientes', 'Baja California', 'Chiapas',   'Chihuahua', 'Coahuila', 'Guerrero',
             'Jalisco',         'Mexico',         'Michoacan', 'Nuevo Leon', 'Puebla',  'Sinaloa',
             'Sonora'],
 'Zetas': ['Campeche',   'Guanajuato', 'Jalisco',    'Mexico',
           'Nuevo Leon', 'Sinaloa',    'Tamaulipas', 'Veracruz', 'Yucatan']
}
[8]:
import csv
def cartels(filename, mexdb, year):
    raise Exception('TODO IMPLEMENT ME !')

cartels2003 = cartels('CosciaRios2012_DataBase.csv', mexico_db, 2003)
from pprint import pprint
pprint(cartels2003, width=190)

assert cartels2003['Beltran_Leyva'] == ['Colima', 'Morelos', 'Sinaloa']
assert cartels2003['Otros'] ==  ['Veracruz']
assert cartels2003['Zetas'] ==  ['Campeche', 'Guanajuato', 'Jalisco', 'Mexico', 'Nuevo Leon', 'Sinaloa', 'Tamaulipas', 'Veracruz', 'Yucatan']
[9]:
# further tests
expected2003 = {
 'Beltran_Leyva': ['Colima', 'Morelos', 'Sinaloa'],
 'Beltran_Leyva_Family':[],
 'Familia': [],
 'Golfo':   ['Campeche', 'Chihuahua', 'Coahuila', 'Durango', 'Mexico', 'Nuevo Leon', 'San Luis Potosi', 'Tamaulipas', 'Veracruz', 'Yucatan'],
 'Juarez':  ['Baja California', 'Chihuahua', 'Coahuila', 'Colima', 'Durango', 'Guerrero', 'Jalisco', 'Sinaloa', 'Tamaulipas'],
 'Otros':   ['Veracruz'],
 'Sinaloa': ['Chiapas', 'Colima', 'Jalisco', 'Mexico', 'Nayarit', 'Nuevo Leon', 'Sinaloa', 'Sonora', 'Tamaulipas'],
 'Sinaloa_Family': ['Guerrero'],
 'Tijuana': ['Aguascalientes', 'Baja California', 'Chiapas', 'Chihuahua', 'Coahuila', 'Guerrero', 'Jalisco', 'Mexico', 'Michoacan', 'Nuevo Leon', 'Puebla', 'Sinaloa', 'Sonora'],
 'Zetas':   ['Campeche', 'Guanajuato', 'Jalisco', 'Mexico', 'Nuevo Leon', 'Sinaloa', 'Tamaulipas', 'Veracruz', 'Yucatan']
}

assert cartels2003 == expected2003

expected1999 = {
    'Beltran_Leyva': [],
    'Beltran_Leyva_Family': [],
    'Familia': [],
    'Golfo':   ['Baja California', 'Guanajuato', 'Nuevo Leon', 'Puebla'],
    'Juarez':  ['Baja California', 'Chihuahua', 'Durango', 'Tamaulipas', 'Veracruz'],
    'Sinaloa': ['Jalisco', 'Veracruz'],
    'Sinaloa_Family': [],
    'Tijuana': ['Baja California', 'Campeche', 'Coahuila', 'Nuevo Leon', 'Sonora', 'Tamaulipas', 'Yucatan'],
    'Zetas':   ['Baja California', 'Mexico', 'Morelos', 'Sinaloa', 'Sonora'],
    'Otros':   []
}

cartels1999 = cartels('CosciaRios2012_DataBase.csv', mexico_db, 1999)
assert cartels1999 == expected1999