University staff
Download worked project
Given the dataset of University of Trento staff (modified so not to contain names or surnames), we want to display:
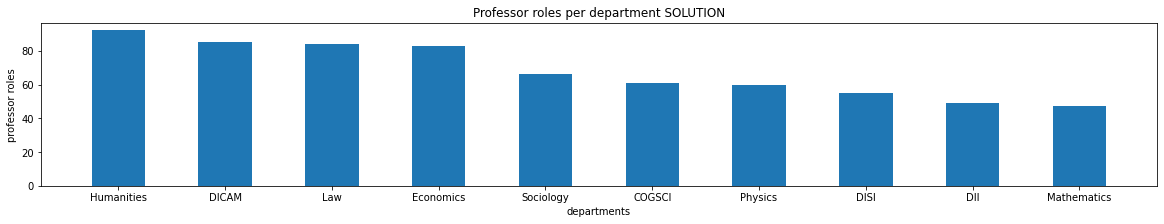
how many professors there are in each department:

given some department, we want to show the roles of its employees as percentages:

Data source: University of Trento, released under Creative Commons Attribution 4.0 licence.
What to do
Unzip exercises zip in a folder, you should obtain something like this:
university-staff-prj
    university-staff.ipynb
    university-staff-sol.ipynb
    2019-06-30-persone-en-stripped.json
    jupman.py
WARNING: to correctly visualize the notebook, it MUST be in an unzipped folder !
open Jupyter Notebook from that folder. Two things should open, first a console and then a browser. The browser should show a file list: navigate the list and open the notebook
university-staff.ipynbGo on reading the notebook, and write in the appropriate cells when asked
Shortcut keys:
to execute Python code inside a Jupyter cell, press
Control + Enterto execute Python code inside a Jupyter cell AND select next cell, press
Shift + Enterto execute Python code inside a Jupyter cell AND a create a new cell aftwerwards, press
Alt + EnterIf the notebooks look stuck, try to select
Kernel -> Restart
load_data
A function load_data is given to load the dataset 2019-06-30-persone-en-stripped.json (you don’t need to implement it):
[1]:
import json

def load_data():
    with open('2019-06-30-persone-en-stripped.json', encoding='utf-8') as json_file:
        data = json.load(json_file)
        return data

unitn = load_data()
IMPORTANT: look at the dataset !
Here we show only first 2 rows, but to get a clear picture of the dataset you should explore it further.
The dataset contains a list of employees, each of whom may have one or more positions, in one or more university units. Each unit is identified by a code like STO0000435:
[2]:
unitn[:2]
[2]:
[{'givenName': 'NAME-1',
  'phone': ['0461 283752'],
  'identifier': 'eb9139509dc40d199b6864399b7e805c',
  'familyName': 'SURNAME-1',
  'positions': [{'unitIdentifier': 'STO0008929',
    'role': 'Staff',
    'unitName': 'Student Support Service: Economics, Law and International Studies'}]},
 {'givenName': 'NAME-2',
  'phone': ['0461 281521'],
  'identifier': 'b6292ffe77167b31e856d2984544e45b',
  'familyName': 'SURNAME-2',
  'positions': [{'unitIdentifier': 'STO0000435',
    'role': 'Associate professor',
    'unitName': 'Doctoral programme – Physics'},
   {'unitIdentifier': 'STO0000435',
    'role': 'Deputy coordinator',
    'unitName': 'Doctoral programme – Physics'},
   {'unitIdentifier': 'STO0008627',
    'role': 'Associate professor',
    'unitName': 'Department of Physics'}]}]
Department names can be very long, so when you need to display them you can use the function this abbreviate.
NOTE: function is already fully implemented, do not modify it.
[3]:
def abbreviate(unitName):

    abbreviations = {

        "Department of Psychology and Cognitive Science": "COGSCI",
        "Center for Mind/Brain Sciences - CIMeC":"CIMeC",
        "Department of Civil, Environmental and Mechanical Engineering":"DICAM",
        "Centre Agriculture Food Environment - C3A":"C3A",
        "School of International Studies - SIS":"SIS",
        "Department of Sociology and social research": "Sociology",
        "Faculty of Law": "Law",
        "Department of Economics and Management": "Economics",
        "Department of Information Engineering and Computer Science":"DISI",
        "Department of Cellular, Computational and Integrative Biology - CIBIO":"CIBIO",
        "Department of Industrial Engineering":"DII"
    }
    if unitName in abbreviations:
        return abbreviations[unitName]
    else:
        return unitName.replace("Department of ", "")
Example:
[4]:
abbreviate("Department of Information Engineering and Computer Science")
[4]:
'DISI'
1. calc_uid_to_abbr
✪ It will be useful having a map from department ids to their abbreviations, if they are actually present, otherwise to their original name. To implement this, you can use the previously defined function abbreviate.
{
 .
 .
 'STO0008629': 'DISI',
 'STO0008630': 'Sociology',
 'STO0008631': 'COGSCI',
 .
 .
 'STO0012897': 'Institutional Relations and Strategic Documents',
 .
 .
}
[5]:
def calc_uid_to_abbr(db):
    raise Exception('TODO IMPLEMENT ME !')

#calc_uid_to_abbr(unitn)
print(calc_uid_to_abbr(unitn)['STO0008629'])  # DISI
print(calc_uid_to_abbr(unitn)['STO0012897'])  # Institutional Relations and Strategic Documents
2.1 calc_prof_roles
✪✪ For each department, we want to see how many professor roles are covered, sorting them from greatest to lowest. In returned list we will only put the 10 department with most roles.
NOTE 1: we are interested in roles covered. Don’t care if actual people might be less (one person can cover more professor roles within the same unit)
NOTE 2: there are several professor roles. Please avoid listing all roles in the code (“Senior Professor’, “Visiting Professor”, ….), and prefer using some smarter way to match them.
Expected result:
>>> calc_prof_roles(unitn)
[('Humanities', 92),
 ('DICAM', 85),
 ('Law', 84),
 ('Economics', 83),
 ('Sociology', 66),
 ('COGSCI', 61),
 ('Physics', 60),
 ('DISI', 55),
 ('DII', 49),
 ('Mathematics', 47)]
[6]:
def calc_prof_roles(db):
    raise Exception('TODO IMPLEMENT ME !')

calc_prof_roles(unitn)
2.2 plot_profs
✪ Write a function to plot a bar chart of data calculated above
[7]:
%matplotlib inline
import matplotlib.pyplot as plt


def plot_profs(db):
    raise Exception('TODO IMPLEMENT ME !')

plot_profs(unitn)
3.1 calc_roles
✪✪ We want to calculate how many roles are covered for each department.
You will group roles by these macro groups (some already exist, some are new):
Professor : “Senior Professor’, “Visiting Professor”, …
Research : “Senior researcher”, “Research collaborator”, …
Teaching : “Teaching assistant”, “Teaching fellow”, …
Guest : “Guest”, …
and discard all the others (there are many, like “Rector”, “Head”, etc ..)
NOTE: Please avoid listing all roles in the code (“Senior researcher”, “Research collaborator”, …), and prefer using some smarter way to match them.
Show solution[8]:
def calc_roles(db):
    raise Exception('TODO IMPLEMENT ME !')

print('STO0000001:', calc_roles(unitn)['STO0000001'])
print('STO0000006:', calc_roles(unitn)['STO0000006'])
print('STO0000012:', calc_roles(unitn)['STO0000012'])
print('STO0008629:', calc_roles(unitn)['STO0008629'])
EXPECTED RESULT - Showing just first ones …
>>> calc_roles(unitn)

{
 'STO0000001': {'Teaching': 9, 'Research': 3, 'Professor': 12},
 'STO0000006': {'Professor': 1},
 'STO0000012': {'Guest': 3},
 'STO0008629': {'Teaching': 94, 'Research': 71, 'Professor': 55, 'Guest': 38}
 .
 .
 .
}
3.2 plot_roles
✪✪ Implement a function plot_roles that given, the abbreviations (or long names) of some departments, plots pie charts of their grouped role distribution, all in one row.
NOTE 1: different plots MUST show equal groups with equal colors
NOTE 2: always show all the 4 macro groups defined before, even if they have zero frequency
For on example on how to plot the pie charts, see this
For on example on plotting side by side, see this

[9]:
%matplotlib inline
import matplotlib.pyplot as plt

def plot_roles(db, abbrs):
    raise Exception('TODO IMPLEMENT ME !')


plot_roles(unitn, ['DISI','Sociology', 'COGSCI'])
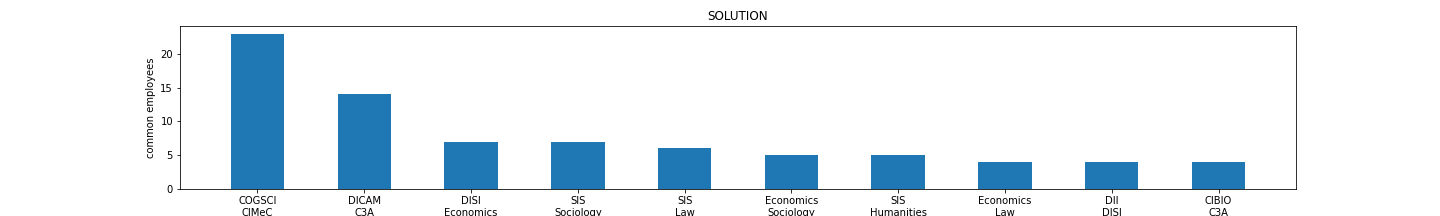
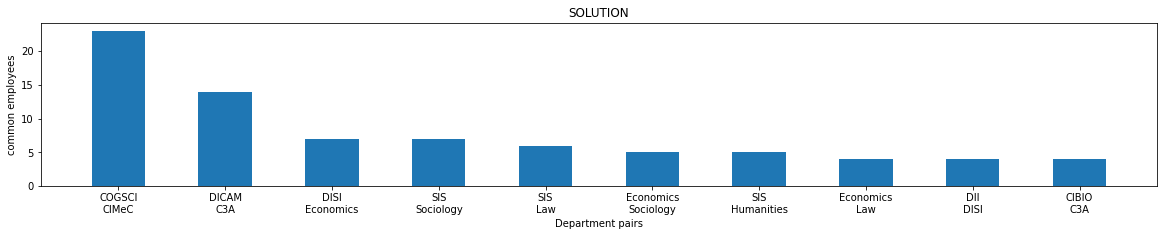
4.2 plot_shared
✪ Plot the above in a bar chart, where on the x axis there are the department pairs and on the y the number of people in common.
[11]:
import matplotlib.pyplot as plt

%matplotlib inline

def plot_shared(db):
    raise Exception('TODO IMPLEMENT ME !')

plot_shared(unitn)
[ ]: